Bakery Bites Q1 Update

 Spring 2026 Edition
The convenience store channel is evolving fast, and bakery is right in the middle of it. Nielsen data across the Total US Convenience market tells an important story: the sweet goods category did $2.59 billion over the latest 52 weeks and $599 million in the most recent quarter. Prairie City Bakery's newer items like Monster Muffins and Coffee House Pound Cakes are driving real growth at the UPC level — and the broader channel trends point to a big opportunity ahead. Here's what the data is telling us and what it means for your business.
$2.59B
Total Sweet Goods · 52 Weeks
Total US Convenience
$78B
US C-Store Foodservice
projected by 2026
85%
Of shoppers have tried
made-to-order c-store food
Monster Muffins and Coffee House Pound Cakes are accelerating fast — growing nearly 190% and 42% respectively in the latest quarter, even as the broader sweet goods category faces headwinds. The growth story at the item level is real and building.
Nielsen UPC Level Data | Total US Convenience | 13 Weeks Ending 02/28/2026
Top Impulse Categories in C-Stores
Salty Snacks
Candy
Baked Goods ← That's Us
More than half of all c-store shoppers pick up baked goods on impulse — making bakery the third-highest impulse category in the entire store. Strategic placement in impulse zones is key. Source: Acosta Group, 2025
Snacking Is Replacing Meals
64% of consumers say they're increasingly likely to replace traditional meals with snacks. Millennials lead at 72%, followed by Gen Z at 70%.
64% Meal ReplacersDaily Indulgence Is the New Normal
67% of shoppers snack daily. A cookie with coffee or pastry at lunch has become a routine — not a special occasion. Millennials and households with kids lead the pack.
67% Daily SnackersSpeed Is Everything
93% of consumers say it's important that a foodservice snack be quickly available. Craveability and accessibility drive the purchase — not just flavor.
93% Want It NowIn-Store Is Where Discovery Happens
The physical store shelf is the #1 source of snack and bakery discovery. "I see it, I have to have it" still wins. That's why placement and packaging matter.
#1 Discovery PointWhat's Driving the Category Forward
Kinetic12's Emergence Chain Restaurant network — 175+ emerging chains with 20–500 units — tracks what's reshaping consumer expectations across foodservice. Three macro trends are converging that have direct implications for bakery's role in convenience and foodservice.
Trend 01
Global Flavors
Consumers — especially Gen Z — are demanding bolder, globally-inspired flavors. Sweet heat, spicy-citrus blends, and fusion profiles are moving from restaurant menus into packaged goods at speed.
87% of Gen Z Want More Global Flavors+20.7% YOY growth in global food conversations · Source: Business Insider Mar 2025; Tastewise 2025
Trend 02
Health Forward
Indulgence is being redefined. 65% of US consumers prefer less sweet products, and 60% say healthy aging matters to them. "Permissible indulgence" is reshaping how sweet goods are positioned.
65% US Consumers Prefer Less Sweet70% look for high-protein options · Source: IFT Oct 2024; Kinetic12 2025
Trend 03
Functional Foods
Foods delivering benefits beyond basic nutrition are exploding. Functional foods are part of a $2 trillion global wellness market — and bakery items with clean, recognizable ingredients benefit from the halo.
$2T Global Wellness MarketFunctional food market growing 10.3% annually · Source: Food & Wine Aug 2024
Top Bold Flavor Trends — What Operators Want on Menus
Source: Kinetic12 Emergence Chain Restaurant, Q3 2025 Report · Base: n=126 operators
Source: Kinetic12 Emergence Chain Restaurant, Charlotte Forum, September 2025. Insights drawn from senior-level operators at emerging chains with 20–500 units.
Kinetic12's Q4 2025 Emergence Report surveyed 130 senior-level leaders at emerging & growth restaurant chains (20–500 units). Their challenges and priorities reveal exactly what operators need from supplier partners — and where bakery fits into the bigger picture.
say driving & maintaining customer traffic is their #1 business challenge
cite profitability pressures as their greatest barrier to growth
say responsiveness & urgency are the #1 quality separating true supplier partners
say consistent execution is now the most powerful way to differentiate a brand
say brand alignment — not novelty — is now the biggest force shaping menu innovation
report flat or declining traffic in Oct 2025 — the battle for every guest visit is real
What This Means for Bakery Conversations
Operators are fighting for every guest and every margin point. Bakery wins when it's framed as a traffic-builder (impulse purchase + repeatability), a profit-protector (strong margin vs. made-to-order foodservice), and a consistency play (thaw-and-sell reliability, no labor required). Prairie City Bakery's model checks all three boxes. And in a world where 74% of operators rank responsiveness as the #1 supplier quality, PCB's in-stock reliability and service level are a competitive argument all their own.
Source: Kinetic12 Emergence Q4 2025 Report. Survey of 130 senior-level operators at emerging & growth restaurant chains with 20–500 units. Data collection: Oct 2025 · kinetic12.com
Over the latest 13 weeks in Total US Convenience, Prairie City Bakery generated $4.29 million in scanned sales. The lineup breaks into two stories: a proven anchor in Ooey Gooey Butter Cakes, and a fast emerging growth engine in Monster Muffins and Coffee House Pound Cakes.
Top 5 Items by Dollar Sales
| # | Item | $ Sales |
|---|---|---|
| 1 | Original Ooey Gooey Butter Cake | $1,036,935 |
| 2 | Chocolate Chunk Down Home Cookie | $600,238 |
| 3 | Sea Salt Caramel Ooey Gooey Butter Cake 3pk | $366,787 |
| 4 | "Mmm" Candy Down Home Cookie | $360,072 |
| 5 | White Chocolate Macadamia Nut Down Home Cookie | $307,357 |
Fastest Growing Items ($ Chg vs YA)
| Item | $ Sales | $ Chg vs YA |
|---|---|---|
| Chocolate Chip Monster Muffin | $101,424 | ▲ +190.4% |
| Banana Nut Monster Muffin | $77,230 | ▲ +188.1% |
| Blueberry Monster Muffin | $91,235 | ▲ +184.8% |
| Iced Lemon Coffee House Pound Cake | $151,284 | ▲ +41.8% |
| Chocolate Iced Chocolate Coffee House Pound Cake | $113,121 | ▲ +26.0% |
| Big n' Fudgy Brownie | $30,433 | ▲ +21.6% |
Monster Muffins: Nearly Tripled
All three Monster Muffin flavors grew 185% to 190% in dollar sales. Combined, the line did $270K and is accelerating — a strong signal of where the brand is heading.
Coffee House Pound Cakes: Building Fast
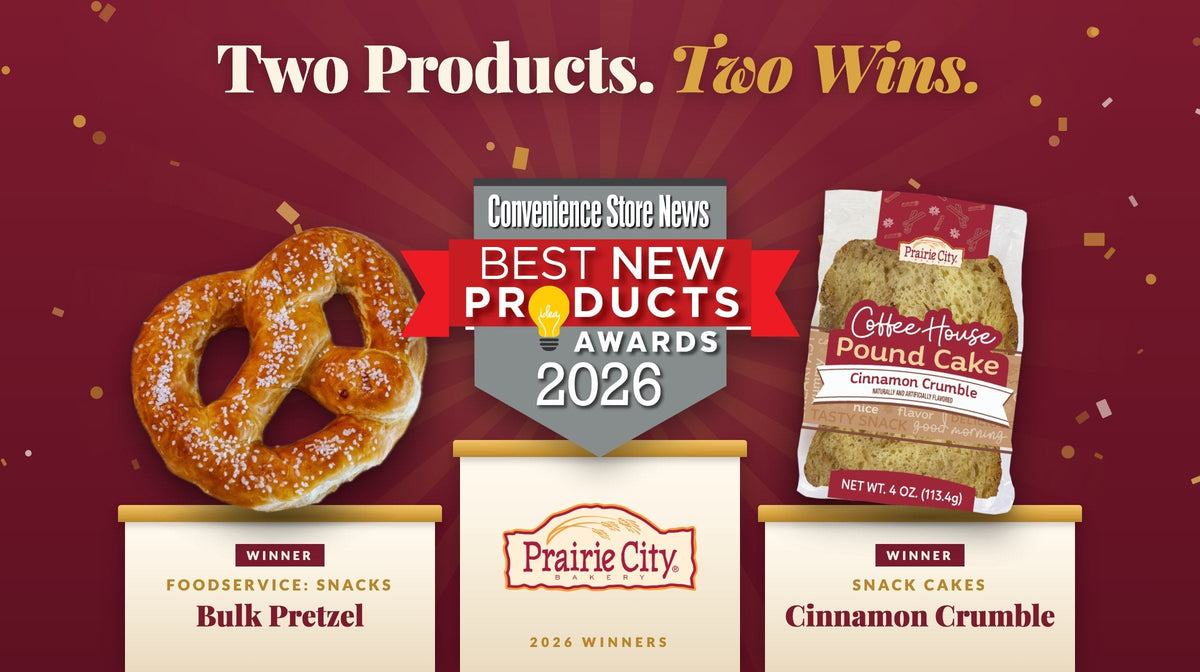
Iced Lemon Coffee House Pound Cake grew +42% and Chocolate Iced Chocolate grew +26%, combining for $264K in the quarter. With the new Cinnamon Crumble hitting shelves, this line has room to run.
Source: Nielsen UPC Level Data, Total US Convenience, 13 Weeks Ending 02/28/2026. Top UPCs by dollar sales and dollar change.
- Monster Muffins nearly tripled in the latest quarter. All three flavors grew 185% to 190% at the UPC level. Combined with the Coffee House Pound Cakes (+42% and +26%), PCB's newer items are driving real momentum even in a down market.
- Bakery is the #3 impulse category in c-stores behind only salty snacks and candy. Lead with this when talking placement and positioning near the register or coffee station.
- The c-store distribution channel for bakery is growing at a 6.38% CAGR, outpacing grocery and mass. There is significant distribution white space for PCB to fill — and the item velocity backs the ask.
- Operators rank responsiveness and consistency as the top qualities in a supplier partner. PCB's thaw-and-sell model, in-stock reliability, and DOT Foods distribution deliver exactly that.
Data Sources
Nielsen Brand Level Brand Share, Total US Convenience (52-wk ending 02/28/2026) · Nielsen Market Level Market Share, Total US Convenience (13-wk ending 02/28/2026) · Nielsen UPC Level Data, Total US Convenience (13-wk ending 02/28/2026) · Acosta Group (2025) · Snack Food & Wholesale Bakery State of the Industry (2025) · Mintel ISB Report (2025) · Mordor Intelligence North America Bakery (2025) · National Restaurant Association (2026) · IFIC Food & Health Survey (2024) · Kinetic12 Emergence Chain Restaurant, Charlotte Forum (Sept 2025) · Kinetic12 Emergence Q4 2025 Report — n=130 senior-level operators (Oct 2025) · Business Insider (Mar 2025) · Tastewise (2025) · IFT (Oct 2024) · Food & Wine (Aug 2024)